Live
-
{{ is_pkg(link.U) }}{{ link.T }} {{ get_host(link.U) }} - {{ link.N }} ( {{ get_host(link.U) }} )
{{ is_pkg(link.U) }}{{ link.T }} {{ get_host(link.U) }}( {{ get_host(link.U) }} )
{{ item.date }}
-
{{ is_pkg(link.U) }}{{ link.T }} {{ get_host(link.U) }} - {{ link.N }}
( {{ get_host(link.U) }} ){{ is_pkg(link.U) }}{{ link.T }} {{ get_host(link.U) }}
( {{ get_host(link.U) }} )
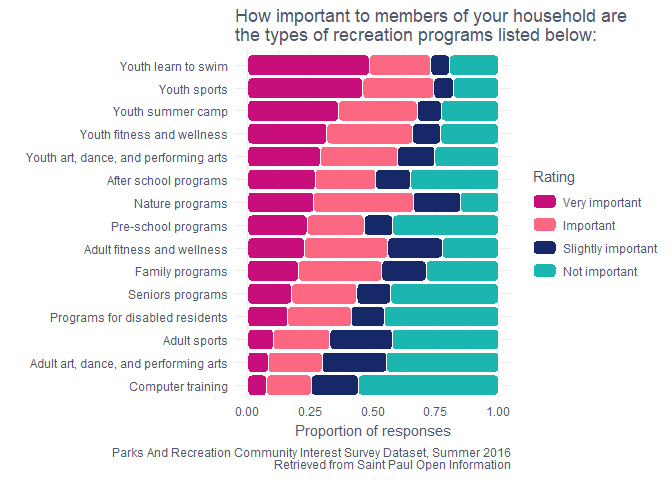
R Weekly 2019-29 useR! Keynote, modelsummary
Highlight
-
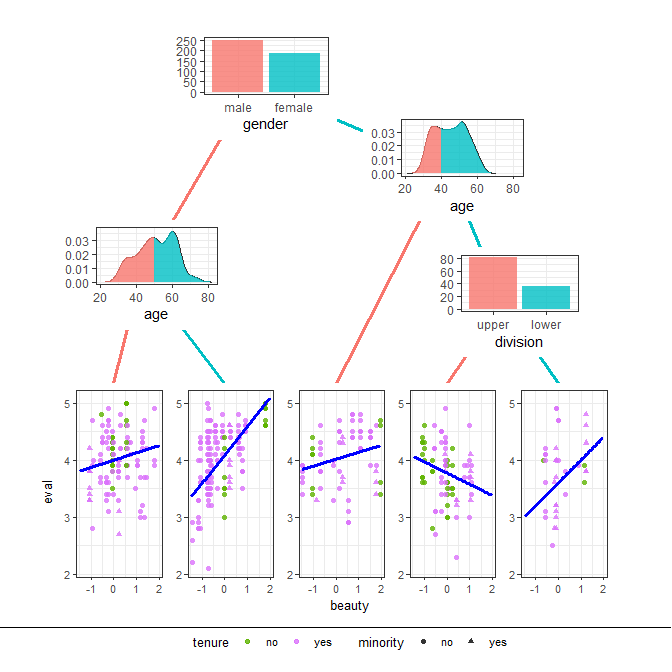
modelsummary - Beautiful, customizable, publication-ready model summaries in R.
Insights
-
My useR! 2019 Highlights & Experience: Shiny, R Community, {packages}, and more!
-
Romain Lesur: The Most Wonderful Collaborator I Have Ever Worked With
R in the Real World
R in Organizations
-
rOpenSci Announces $678K Award from the Sloan Foundation to Expand Software Peer Review
-
rOpenSci Hiring for New Position in Statistical Software Testing and Peer Review
Resources
New Packages
CRAN
- modelsummary - Beautiful, customizable, publication-ready model summaries in R.
Updated Packages
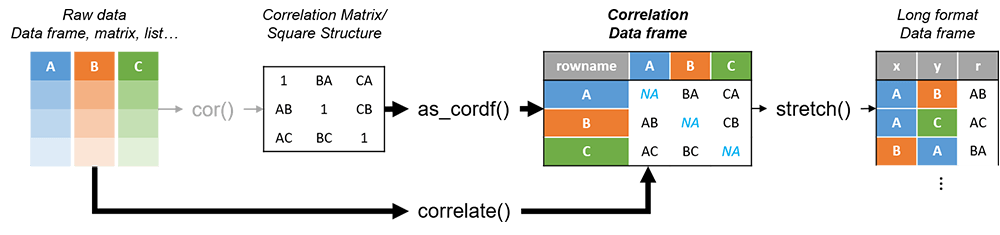
- corrr 0.4.0 - corrr is a package for exploring correlations in R
Videos and Podcasts
Tutorials
-
What NOT to do when building a shiny app (lessons learned the hard way)
-
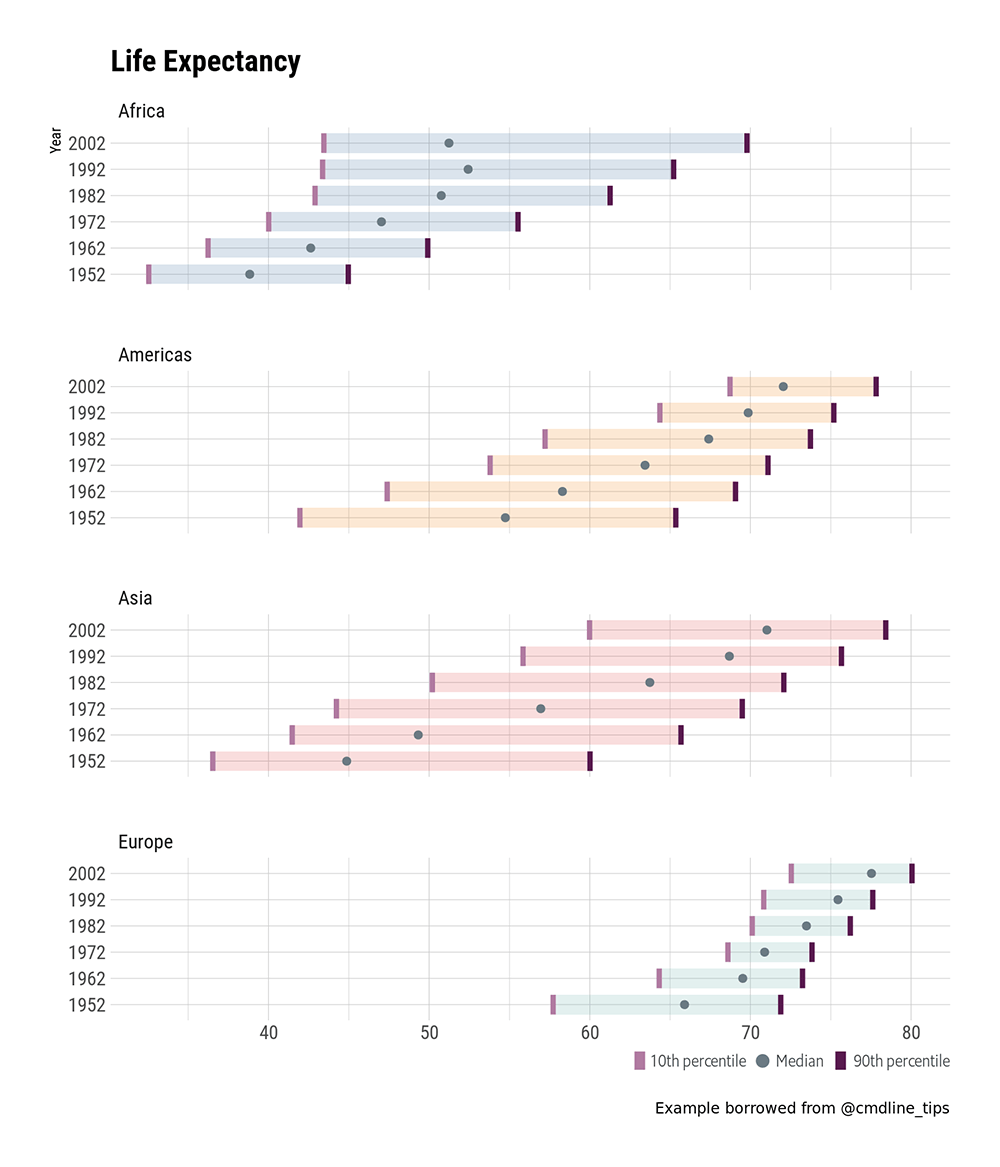
Dotplot – the single most useful yet largely neglected dataviz type
R Project Updates
Updates from R Core:
Upcoming Events in 3 Months
Events in 3 Months:
-
Mexico CDSB Workshop 2019, July 29 - August 2 - How to Build and Create Tidy Tools
-
LatinR 2019, Santiago de Chile, September 25 - 27 - Latinamerican Conference About the Use of R in R&D
More past events at R conferences & meetups.
Call for Participation
Quotes of the Week
By using the autoplot() function from the "ggfortify" package I can check assumptions for linear models:
— Romain Lefèvre 🐾 (@lefevreromain_) July 14, 2019
-Q-Q plot: normality
-Residuals vs Fitted: linear relationship
-Scale-Location: homogeneity of the variance
-Residuals vs Leverage/Cook's distance: influential cases#rstats pic.twitter.com/GksKYXYVfg
Your underrated #rstats package today is "ids" by @rgfitzjohn which allows you to create unique identifiers quickly and easily https://t.co/nVTmFOM2DF
— Andr(é|ew) MacDonald (@polesasunder) July 17, 2019
like here, i create a list of "adjective_animal" names to support an anonymous selection process pic.twitter.com/wabRIJiZWh