R Weekly 2020-44 {emphatic}, American political data, data science teaching
Release Date: 2020-11-01
This week’s release was curated by Tony ElHabr, with help from the RWeekly team members and contributors.
Highlight
-
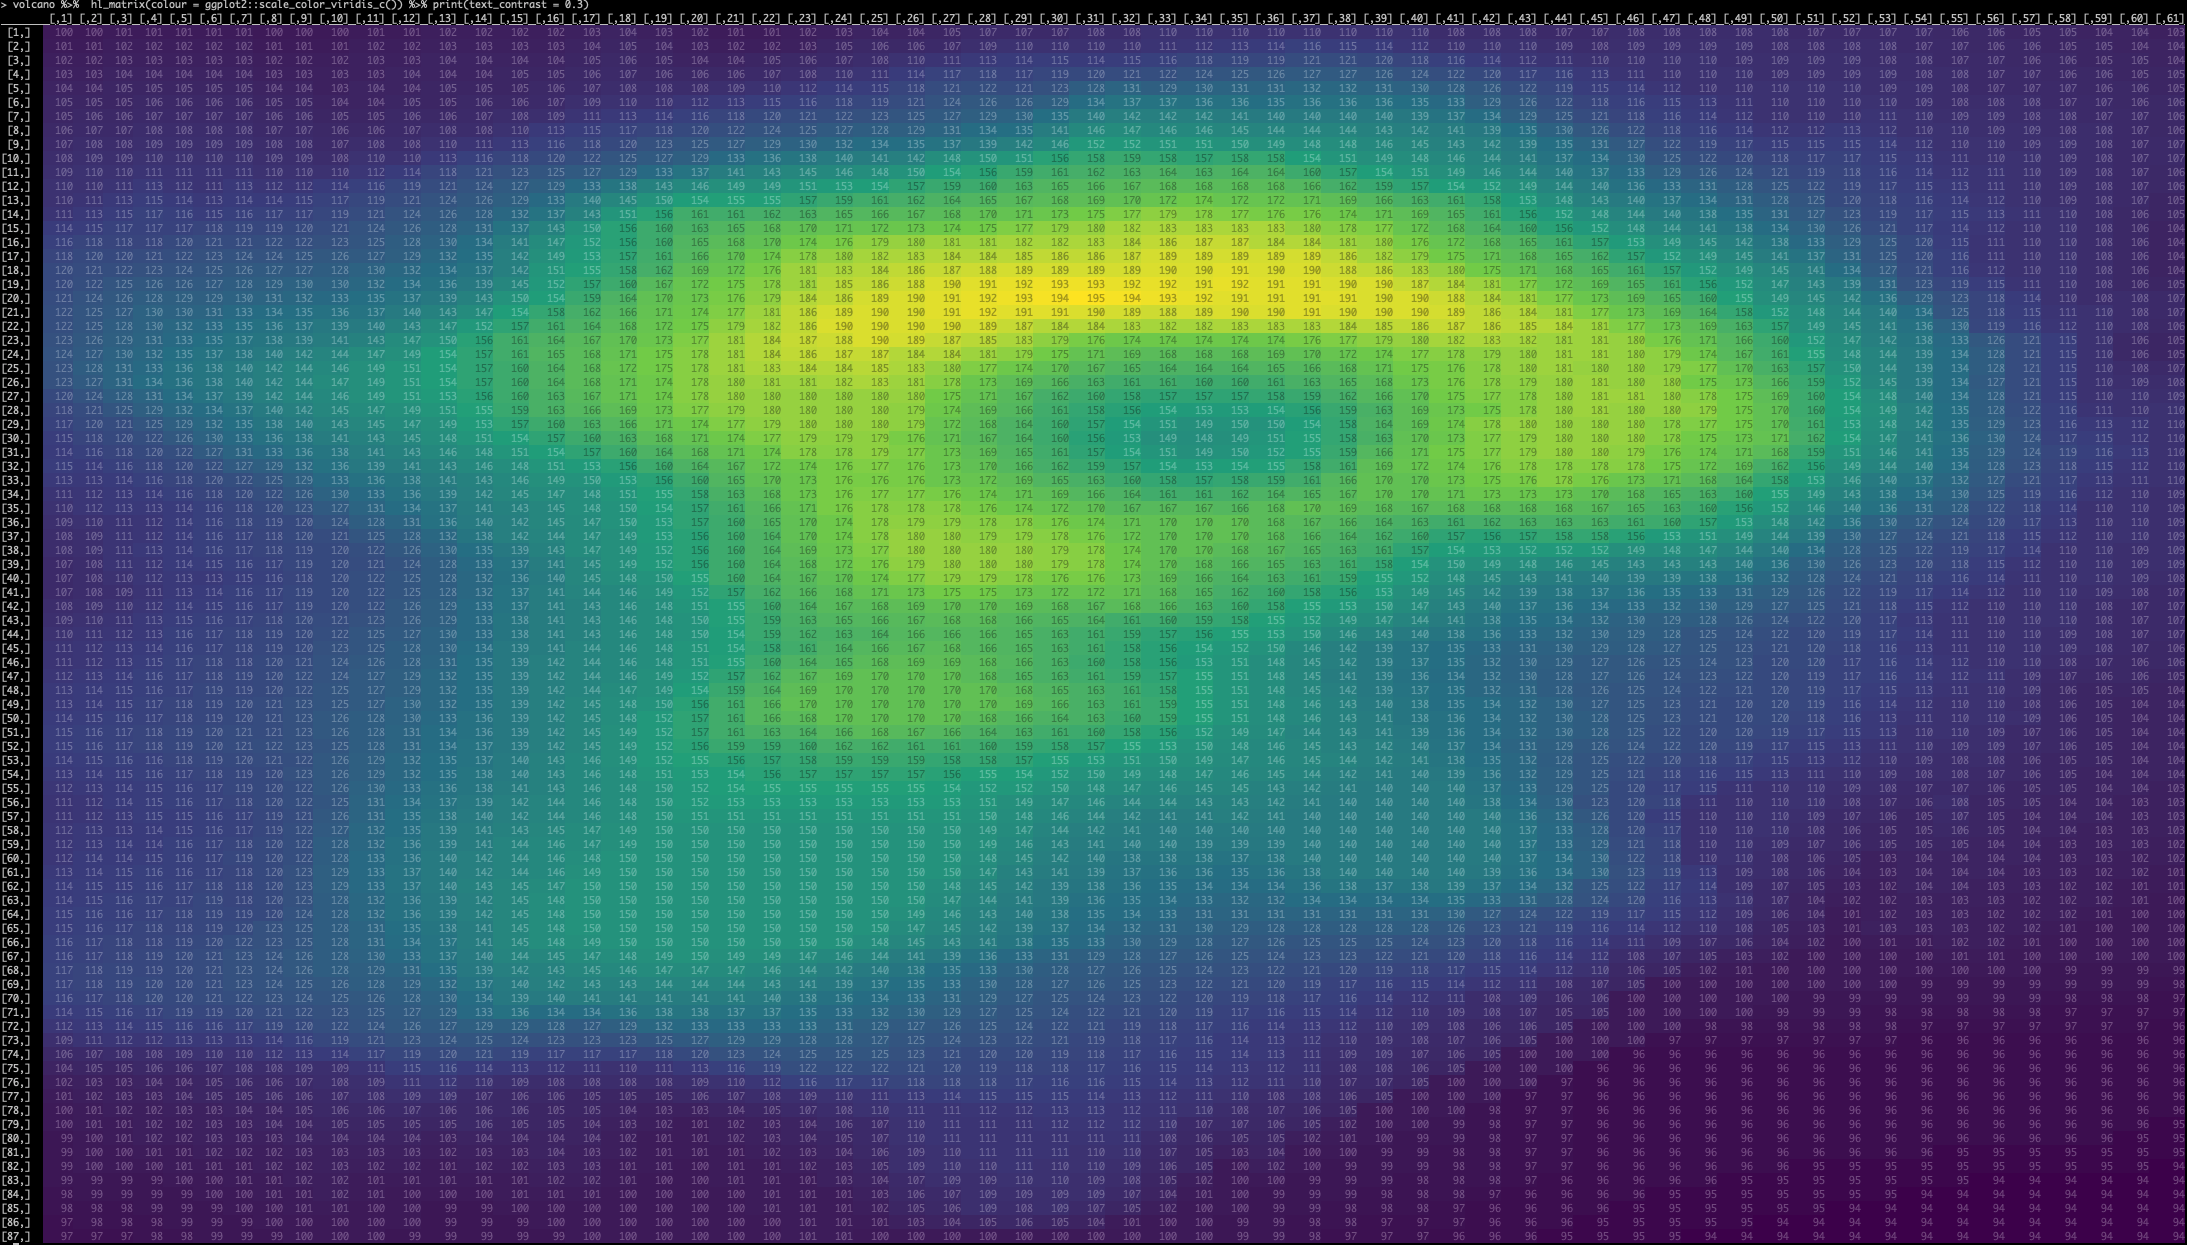
{emphatic}: Augments the output of data.frames and matrices in R by adding user-defined ANSI highlighting.
-
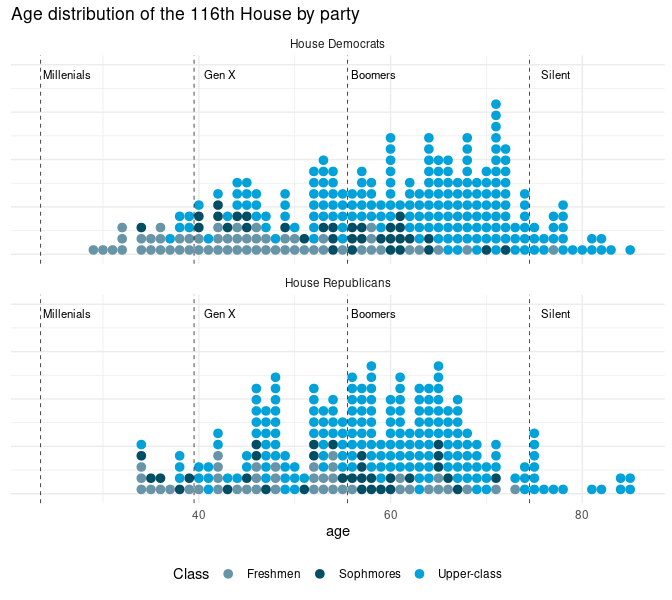
A guide to accessing & analyzing open source American political data using R
Insights
R in the Real World
-
Using the Mapbox API and Tidycensus to analyze major commuter routes in Pittsburgh
-
Tensor-Based Anomaly Detection in Multivariate Spatio-Temporal Data
-
EDA of my reading activity on Goodreads using the tidyverse ecosystem
R in Organizations
R in Academia
Resources
New Packages
CRAN
- {linne} 0.0.2: Convenient ‘CSS’
- {starwarsdb}: Relational Data from the ‘Star Wars’ API for Learning and Teaching. Includes local tables and a database version using DuckDB.
- {torchvision}: Provides access to datasets, models and preprocessing facilities for deep learning with images.
- {shinyscreenshot} 0.1.0: Capture Screenshots of Entire Pages or Parts of Pages in ‘Shiny’
- {groundhog} 1.0.0: Reproducible Scripts via Version-Specific Package Loading
- {oskeyring} 0.1.0: Raw System Credential Store Access from R
- {nlstac} 0.1.0: An R Package for Fitting Separable Nonlinear Models
- {xmlconvert} 0.1.0: Comfortably Converting XML Documents to Dataframes and Vice Versa
- {PDE} 1.0.2: Extract Sentences and Tables from PDFs with User Interface
- {deepgp} 0.1.0: Sequential Design for Deep Gaussian Processes using MCMC
- {ts.extend} 0.1.0: Stationary Gaussian ARMA Processes and OtherTime-Series Utilities
- {fflr} 0.3.10: Collect ESPN Fantasy Football Data
- {cspp} 0.3.0: A Tool for the Correlates of State Policy Project Data
- {tsensembler} 0.1.0: Dynamic Ensembles for Time Series Forecasting
- {sugarbag} 0.1.3: Create Tessellated Hexagon Maps
- {bccp} 0.1.0: Bias Correction under Censoring Plan
- {DIDmultiplegt} 0.1.0: Estimation in DID with Multiple Groups and Periods
- {swissdd} 1.0.4: Get Swiss Federal and Cantonal Vote Results from Opendata.swiss
- {PRIMME} 3.1-3: Eigenvalues and Singular Values and Vectors from Large Matrices
GitHub or Bitbucket
- {emphatic}: Augments the output of data.frames and matrices in R by adding user-defined ANSI highlighting.
- {betweenthepipes}: This package hosts tutorials (created with the learnr package) and sample data sets that are designed to facilitate learning the tidyverse with hockey data.
- {Spectre}: A computational toolkit in R for the integration, exploration, and analysis of high-dimensional single-cell cytometry data.
- {poweRof10}: Tools to access data from athletics rankings website www.thepowerof10.info
-
{epifitter}: An R package for analysis and simulation of plant disease progress curves.
- {report}: Automated reporting of objects in R.
- {OregonTrail}: Port of the 1978 ‘Oregon Trail’ history game
Updated Packages
- {squashinformr} v0.1.4: Scrape SquashInfo for data on the Professional Squash Association World Tour and other squash events.
- {patrick} 0.0.3: An extension of the ‘testthat’ package that lets you add parameters to your unit tests. Parameterized unit tests are often easier to read and more reliable, since they follow the DNRY (do not repeat yourself) rule.
- {lubridateExtras}: Convenience Functions for Manipulating Datetimes.
- {ICON} v0.4.0: data package containing 1,075 complex networks from the Colorado Index of Complex Networks.
- {officer} 0.3.15: Manipulation of Microsoft Word and PowerPoint Documents
- {googlePolylines} 0.8.1: Encoding Coordinates into ‘Google’ Polylines
- {gotop} 0.1.2: Scroll Back to Top Icon in ‘rmarkdown’ and ‘shiny’
- {gginference} 0.1.3: Visualise the Results of Inferential Statistics using ‘ggplot2’
- {sfheaders} 0.3.0: Converts Between R Objects and Simple Feature Objects
- {testthat} 3.0.0: Unit Testing for R
- {ggdist} 2.3.0: Visualizations of Distributions and Uncertainty
- {tufte} 0.8: Tufte’s Styles for R Markdown Documents
- {xfun} 0.19: Miscellaneous Functions by ‘Yihui Xie’
- {distr6} 1.4.5: The Complete R6 Probability Distributions Interface
- {tidyBF} 0.4.0: Tidy Wrapper for ‘BayesFactor’ Package
- {Hmsc} 3.0-9: Hierarchical Model of Species Communities
- {sjPlot} 2.8.6: Data Visualization for Statistics in Social Science
- {modeltime} 0.3.0: The Tidymodels Extension for Time Series Modeling
- {quantreg} 5.75: Quantile Regression
- {huxtable} 5.1.1: Easily Create and Style Tables for LaTeX, HTML and Other Formats
- {drake} 7.12.7: A Pipeline Toolkit for Reproducible Computation at Scale
- {odbc} 1.3.0: Connect to ODBC Compatible Databases (using the DBI Interface)
Videos and Podcasts
-
TidyX Episode 33: Beer and State Maps (Reviewing work by Richard Bamattre)
-
Date Night: Using {lubridate} to work with dates in R - Jenny Richmond (R-Ladies Sydney)
-
Prettier R Graphs and Documents with {showtext}+{prettydoc} - Yixuan Qiu (Greater Cleveland R Group)
Shiny Apps
R Internationally
Tutorials
-
Using Github Actions and Data Version Control for ModelOps in R
-
Tune and interpret decision trees for #TidyTuesday wind turbines
-
A refined brute force method to inform simulation of ordinal response data

-
Making a poster (with {magick}) to remind everyone of social distance courtesy on Halloween
-
The Central Limit Theorem (CLT): From Perfect Symmetry to the Normal Distribution
R Project Updates
Updates from R Core:
Upcoming Events in 3 Months
Events in 3 Months:
-
R-Ladies Tunis: Data Visualization for Machine Learning Practioners - Julia Silge, November 7
-
Brazilian Conference on Data Journalism and Digital Methods – Coda.Br 2020, November 2 - 7, 2020
-
DN Unlimited 2020: Europe’s largest data science gathering, November 18 – 20 (online)
Call for Participation
Quotes of the Week
I want to hear your SpOoOky data stories! 🎃
— Caitlin Boo-don 👻 (@beeonaposy) October 26, 2020
Please share a tweet-length story (or two) of the scariest data monsters you've mashed 👇
so I'm working on a project to showcase to beginners why #rstats is fun and legitimately this could take weeks because there are SO MANY GOOD THINGS!
— Jesse Mostipak (@kierisi) October 21, 2020
but if you could *only* give three reasons//examples why R is fun, what would they be?
I want to use the #30daymapchallenge to play around with some interactive map viz in #rstats.
— Alexandra Kapp (@lxndrkp) November 1, 2020
Results will be posted here: 🎉 https://t.co/cYDWHu6eG4
Day 1 (Points): All +80.000 registered cars in XHain mapped onto the streets #mapdeckhttps://t.co/0dY2peWr8r pic.twitter.com/W76dSYIXpf