Live
-
{{ is_pkg(link.U) }}{{ link.T }} {{ get_host(link.U) }} - {{ link.N }} ( {{ get_host(link.U) }} )
{{ is_pkg(link.U) }}{{ link.T }} {{ get_host(link.U) }}( {{ get_host(link.U) }} )
{{ item.date }}
-
{{ is_pkg(link.U) }}{{ link.T }} {{ get_host(link.U) }} - {{ link.N }}
( {{ get_host(link.U) }} ){{ is_pkg(link.U) }}{{ link.T }} {{ get_host(link.U) }}
( {{ get_host(link.U) }} )
R Weekly 2021-W01 Data Science Box, Vote, blogdown
This week’s release was curated by Wolfram King, with help from the R Weekly team members and contributors.
Highlight
-
Data Science Course in a Box - The core content of the course focuses on data acquisition and wrangling, exploratory data analysis, data visualization, inference, modelling, and effective communication of results.
-
A version of the famous visualization - Land doesn’t vote, people do
Insights
R in the Real World

-
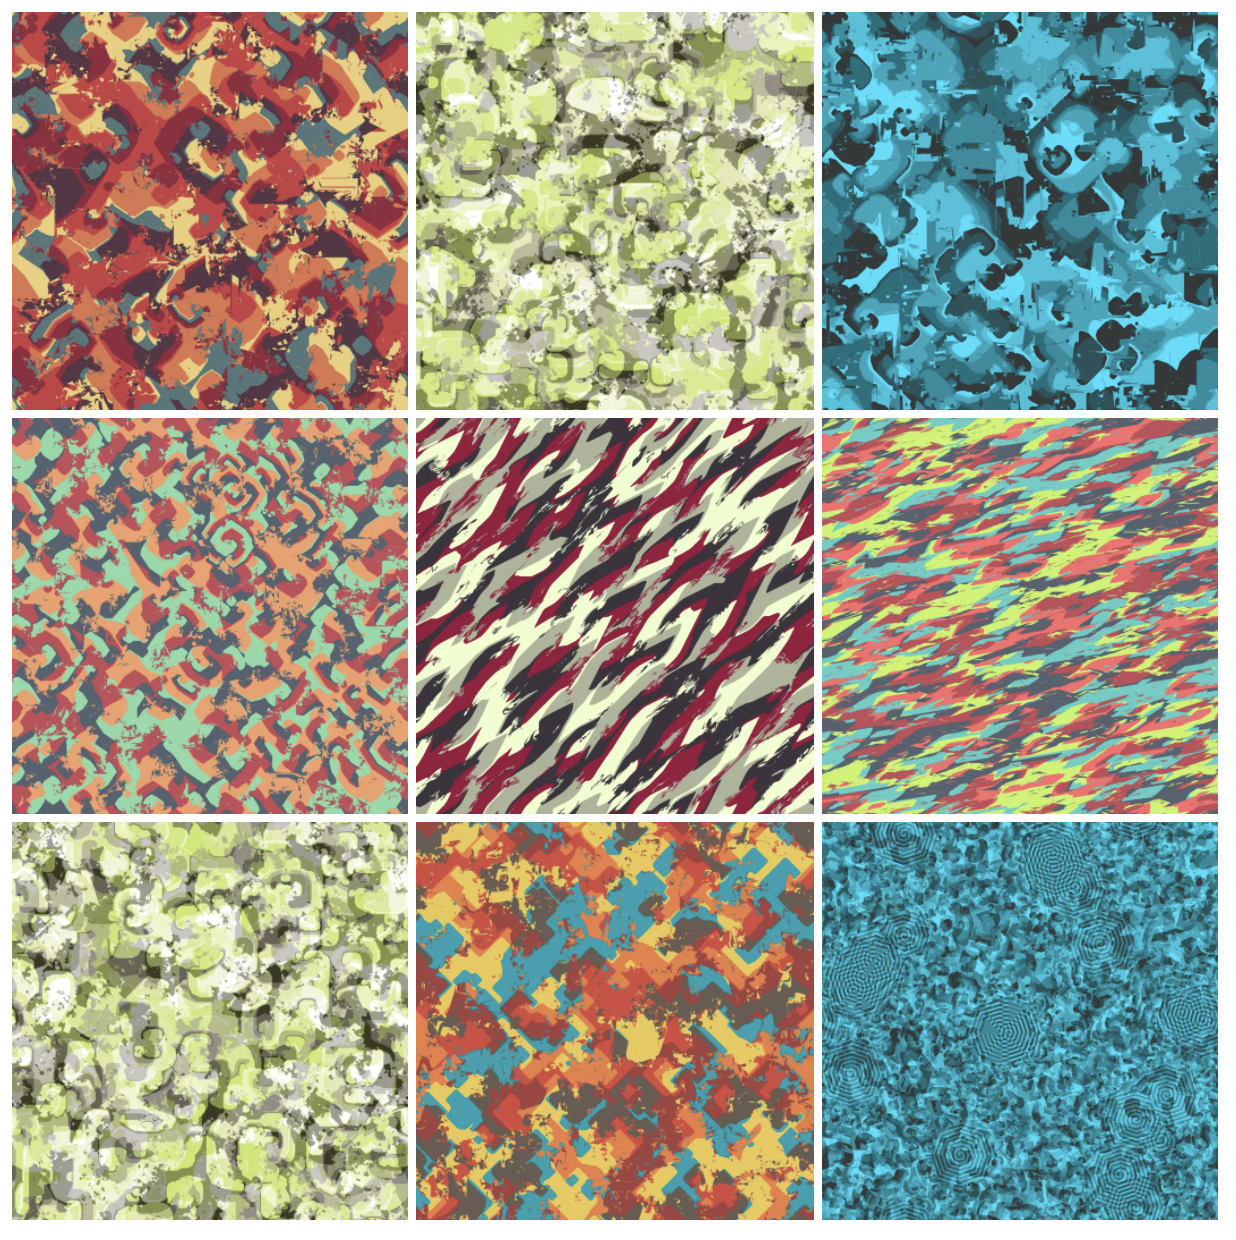
RObservations #6- #TidyTuesday – Analyzing data on the Australian Bush Fires
-
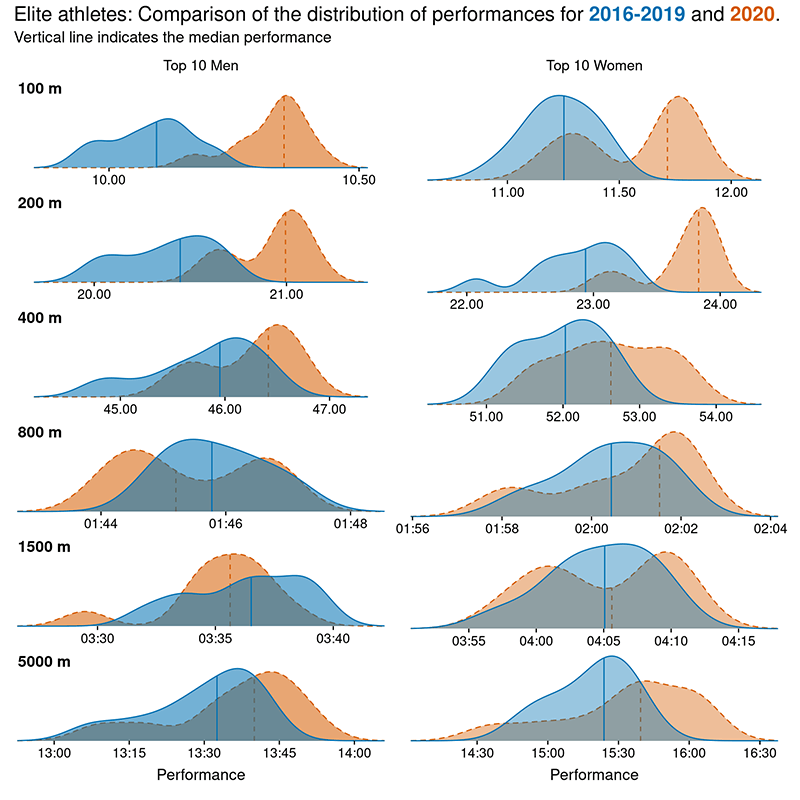
Revisited: Animating 2020 running goals - and compare them with previous years
Resources
- Data Science Course in a Box - The core content of the course focuses on data acquisition and wrangling, exploratory data analysis, data visualization, inference, modelling, and effective communication of results.
New Packages
CRAN
- {tm.plugin.koRpus} 0.4-1: Full Corpus Support for the ‘koRpus’ Package
Updated Packages
-
{ggplot2} 3.3.3: Create Elegant Data Visualisations Using the Grammar of Graphics
-
{data.table} 1.13.6: Extension of
data.frame -
{rlang} 0.4.10: Functions for Base Types and Core R and ‘Tidyverse’ Features
-
{cowplot} 1.1.1: Streamlined Plot Theme and Plot Annotations for ‘ggplot2’
Videos and Podcasts
Tutorials
-
How to use $ (dollar sign) in R: 6 Examples – list & dataframe
- Little Helpers: Character index counter +
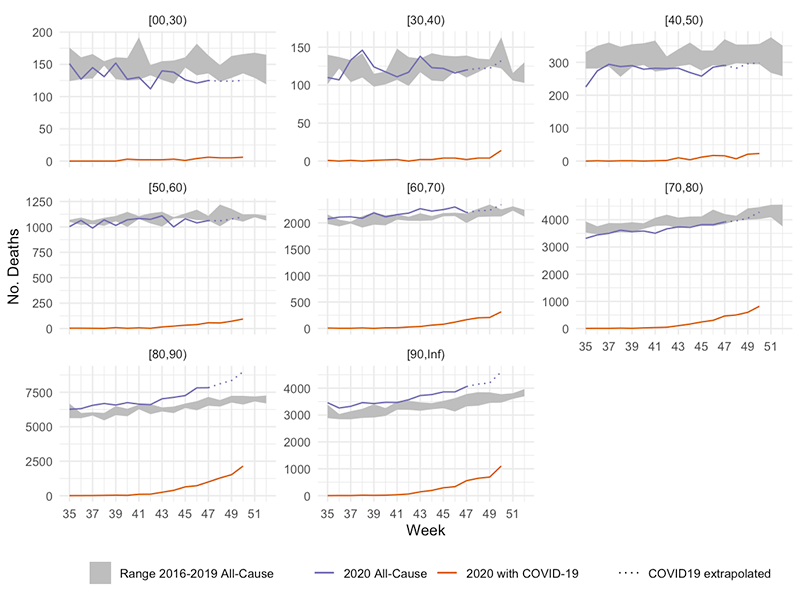
- Age Stratified All-Cause and COVID-19 Associated Mortality
R Project Updates
Updates from R Core:
Upcoming Events in 3 Months
Events in 3 Months:
Call for Participation
Quotes of the Week
#rstats
— Kyle Cuilla (@kc_analytics) January 2, 2021
How it started How it’s going pic.twitter.com/mGzn9vqOBt
Don't trust choropleth maps. Evidence from Switzerland! 😉 #RStats
— David Zumbach (@DavidZumbach) December 31, 2020
Shout-outs to @thomasp85 for {transformr}/{particles}, @hadleywickham et al. for {ggplot2}/{dplyr}, @edzerpebesma for {sf}, @politan_ch for {swissdd} and @hrbrmstr for {hrbrthemes}.
➡️ https://t.co/xQchB1XRPb pic.twitter.com/pzalnCUqQW