Live
-
{{ is_pkg(link.U) }}{{ link.T }} {{ get_host(link.U) }} - {{ link.N }} ( {{ get_host(link.U) }} )
{{ is_pkg(link.U) }}{{ link.T }} {{ get_host(link.U) }}( {{ get_host(link.U) }} )
{{ item.date }}
-
{{ is_pkg(link.U) }}{{ link.T }} {{ get_host(link.U) }} - {{ link.N }}
( {{ get_host(link.U) }} ){{ is_pkg(link.U) }}{{ link.T }} {{ get_host(link.U) }}
( {{ get_host(link.U) }} )
R Weekly 2018-23 Advice, R Consortium
Highlight
New Packages
CRAN
GitHub or Bitbucket
Package Releases
- WVPlots 1.0.0 - Common Plots for Analysis

Insights
R in the Real World
-
Harry Potter and rankings with comperank: Ranking Harry Potter books with {comperank} package
-
Visualizing crochet circles and spirals with {ggplot2} package
-
Planning your UCSC Extension Program Schedule with Web Scraping and the tidyverse
-
Visualization of week 1 of the CrossFit regionals. Data scraped, wrangled, and plotted using R.


Resources
R in Organizations
-
Announcing the R Consortium ISC Funded Project grant recipients for Spring 2018
-
rOpenSci unconference 2018 introduction to TensorFlow Probability & the greta package
R Internationally
Tutorials

-
Summertime Fun! Graphs with LaCroixColoR, Magick Animations + More!
-
Extract the most important sentences from an article of text
-
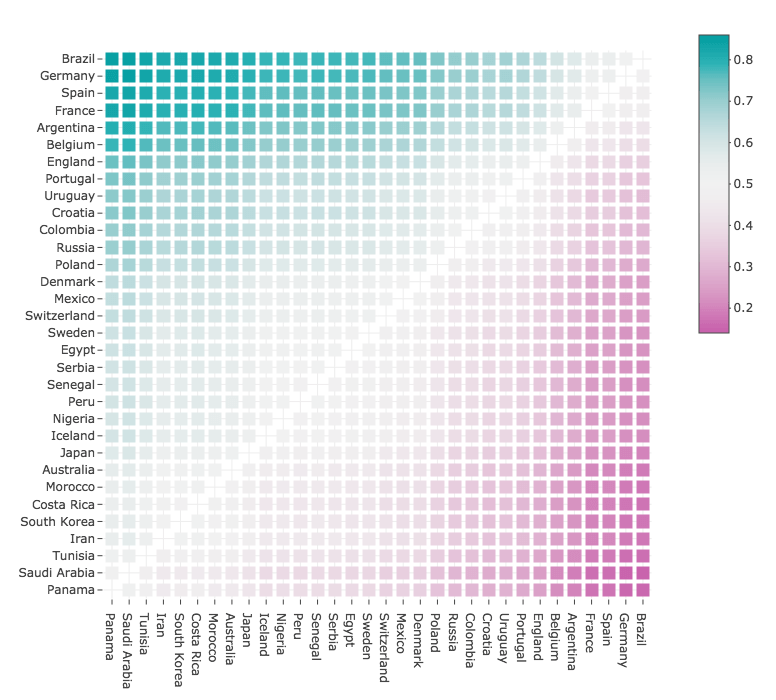
How to rank the 32 teams in the 2018 FIFA World Cup with R and the ‘elo’ package
-
The Fix Is In: Finding infix functions inside contributed R package “utilities” files

Upcoming Events in 3 Months
Events in 3 Months:
-
7eme Rencontres R July 5 & 6
Rennes - Agrocampus -
useR! 2018 July 10
The annual useR! conference is the main meeting of the international R user and developer community. -
LatinR 2018 Sept 4-5
Buenos Aires, Argentina.
This week’s local R-User and applied stats events (week of 2018-06-04)
More past events at R conferences & meetups.
Call for Participation
Quotes of the Week
#RStats — I just discovered the "Rename in scope" option from @rstudio, that allows you to rename all the variables with the same name (and just the variables) from a script in just one shot 😱
— Colin Fay (@_ColinFay) May 30, 2018
[How to]
- Select a variable
- Go to: Code > Rename in scope
- Rename 🎉 pic.twitter.com/AJFEHpFGQb
Serious shoutout to @cascadiarconf - the only tech conference I’ve ever seen that has built-in childcare and lactation rooms.
— heatheronormative (@heatherklus) May 24, 2018
Everyone else:
Get 👏 on 👏 their 👏 level 👏 👏 👏
I started with #rstats before the @tidyverse was really a thing and mostly switched to #Python except for a few specific uses. Relearning R now is like finding out someone did a secret makeover of my apartment and now I live in a castle.
— Jacob Deppen (@jacob_deppen) May 31, 2018
Make #ggplot2 easily Try our new #RStudio addin 🤗! Feedbacks are welcome ! #rstats https://t.co/U1dT2zPFND pic.twitter.com/WnpbjoL8rx
— dreamRs (@dreamRs_fr) May 29, 2018